What’s animint2?
It’s a package of R which makes visualization interactive. Animint2 is a fork of ggplot2 that makes it possible to design multi-layer, multi-plot, interactive, and possibly animated data visualizations using just a few lines of R code.
Animint was created in 2013 with the aim to provide a tool to make interactive animated graphs. Animint2 required ggplot2 in order to function properly. But due to some incompatible changes introduced in ggplot2 during 2014-17 it became hard to keep things up and going.
So, In 2018, animint2 was created which copies/forks relevant parts of ggplot2 package. Now, animint2 can be used without needing ggplot2.
It is recommended not to import ggplot2 directly when using animint2.
How it works?
Animint2 adds the clickSelects and showSelected interactive keywords to the grammar of graphics, and renders to the web using D3.
Installation?
Download from CRAN:
install.packages("animint2")
Or
Install from Source Code: Clone from GitHub repo(animint2)
git clone https://github.com/tdhock/animint2.git
R CMD INSTALL animint2
As of now, the best source to learn about animint2 is the Animint2 Designer Manual
Example:
Code:
library(animint2)
data(WorldBank)
not.na <- subset(WorldBank, !(is.na(life.expectancy) | is.na(fertility.rate)))
subset(not.na, is.na(not.na$population))
subset(not.na, country == "Kuwait" & 1991 <= year & year <= 1995)
not.na[not.na$country=="Kuwait", "population"] <- 1700000
BOTH <- function(df, top, side){
  data.frame(df,
             top=factor(top, c("Fertility rate", "Years")),
             side=factor(side, c("Years", "Life expectancy")))
}
TS <- function(df)BOTH(df, "Years", "Life expectancy")
SCATTER <- function(df)BOTH(df, "Fertility rate", "Life expectancy")
TS2 <- function(df)BOTH(df, "Fertility rate", "Years")
years <- unique(not.na[, "year", drop=FALSE])
by.country <- split(not.na, not.na$country)
min.years <- do.call(rbind, lapply(by.country, subset, year == min(year)))
min.years$year <- 1958
wb.facets <-
  list(ts=ggplot()+
         theme_bw()+
         theme(panel.margin=grid::unit(0, "lines"))+
         xlab("")+
         ylab("")+
         geom_tallrect(aes(xmin=year-1/2, xmax=year+1/2),
                       clickSelects="year",
                       data=TS(years), alpha=1/2)+
         theme_animint(width=1000, height=800)+
         geom_line(aes(year, life.expectancy, group=country, colour=region),
                   clickSelects="country",
                   data=TS(not.na), size=4, alpha=3/5)+
         geom_point(aes(year, life.expectancy, color=region, size=population),
                    showSelected="country", clickSelects="country",
                    data=TS(not.na))+
         geom_text(aes(year, life.expectancy, colour=region, label=country),
                   showSelected="country",
                   clickSelects="country",
                   data=TS(min.years), hjust=1)+

         geom_widerect(aes(ymin=year-1/2, ymax=year+1/2),
                       clickSelects="year",
                       data=TS2(years), alpha=1/2)+
         geom_path(aes(fertility.rate, year, group=country, colour=region),
                   clickSelects="country",
                   data=TS2(not.na), size=4, alpha=3/5)+
         geom_point(aes(fertility.rate, year, color=region, size=population),
                    showSelected="country", clickSelects="country",
                    data=TS2(not.na))+

         geom_point(aes(fertility.rate, life.expectancy, colour=region, size=population,
                        key=country), # key aesthetic for animated transitions!
                    clickSelects="country",
                    showSelected="year",
                    data=SCATTER(not.na))+
         geom_text(aes(fertility.rate, life.expectancy, label=country,
                       key=country), #also use key here!
                   showSelected=c("country", "year", "region"),
                   clickSelects="country",
                   data=SCATTER(not.na))+
         scale_size_animint(breaks=10^(9:5))+
         facet_grid(side ~ top, scales="free")+
         geom_text(aes(5, 85, label=paste0("year = ", year)),
                   showSelected="year",
                   data=SCATTER(years)),

       time=list(variable="year", ms=3000),

       duration=list(year=1000),

       first=list(year=1975, country=c("United States", "Vietnam")),

       selector.types=list(country="multiple"),

       title="World Bank data (multiple selection, facets)")

animint2dir(wb.facets, "WorldBank-facets")
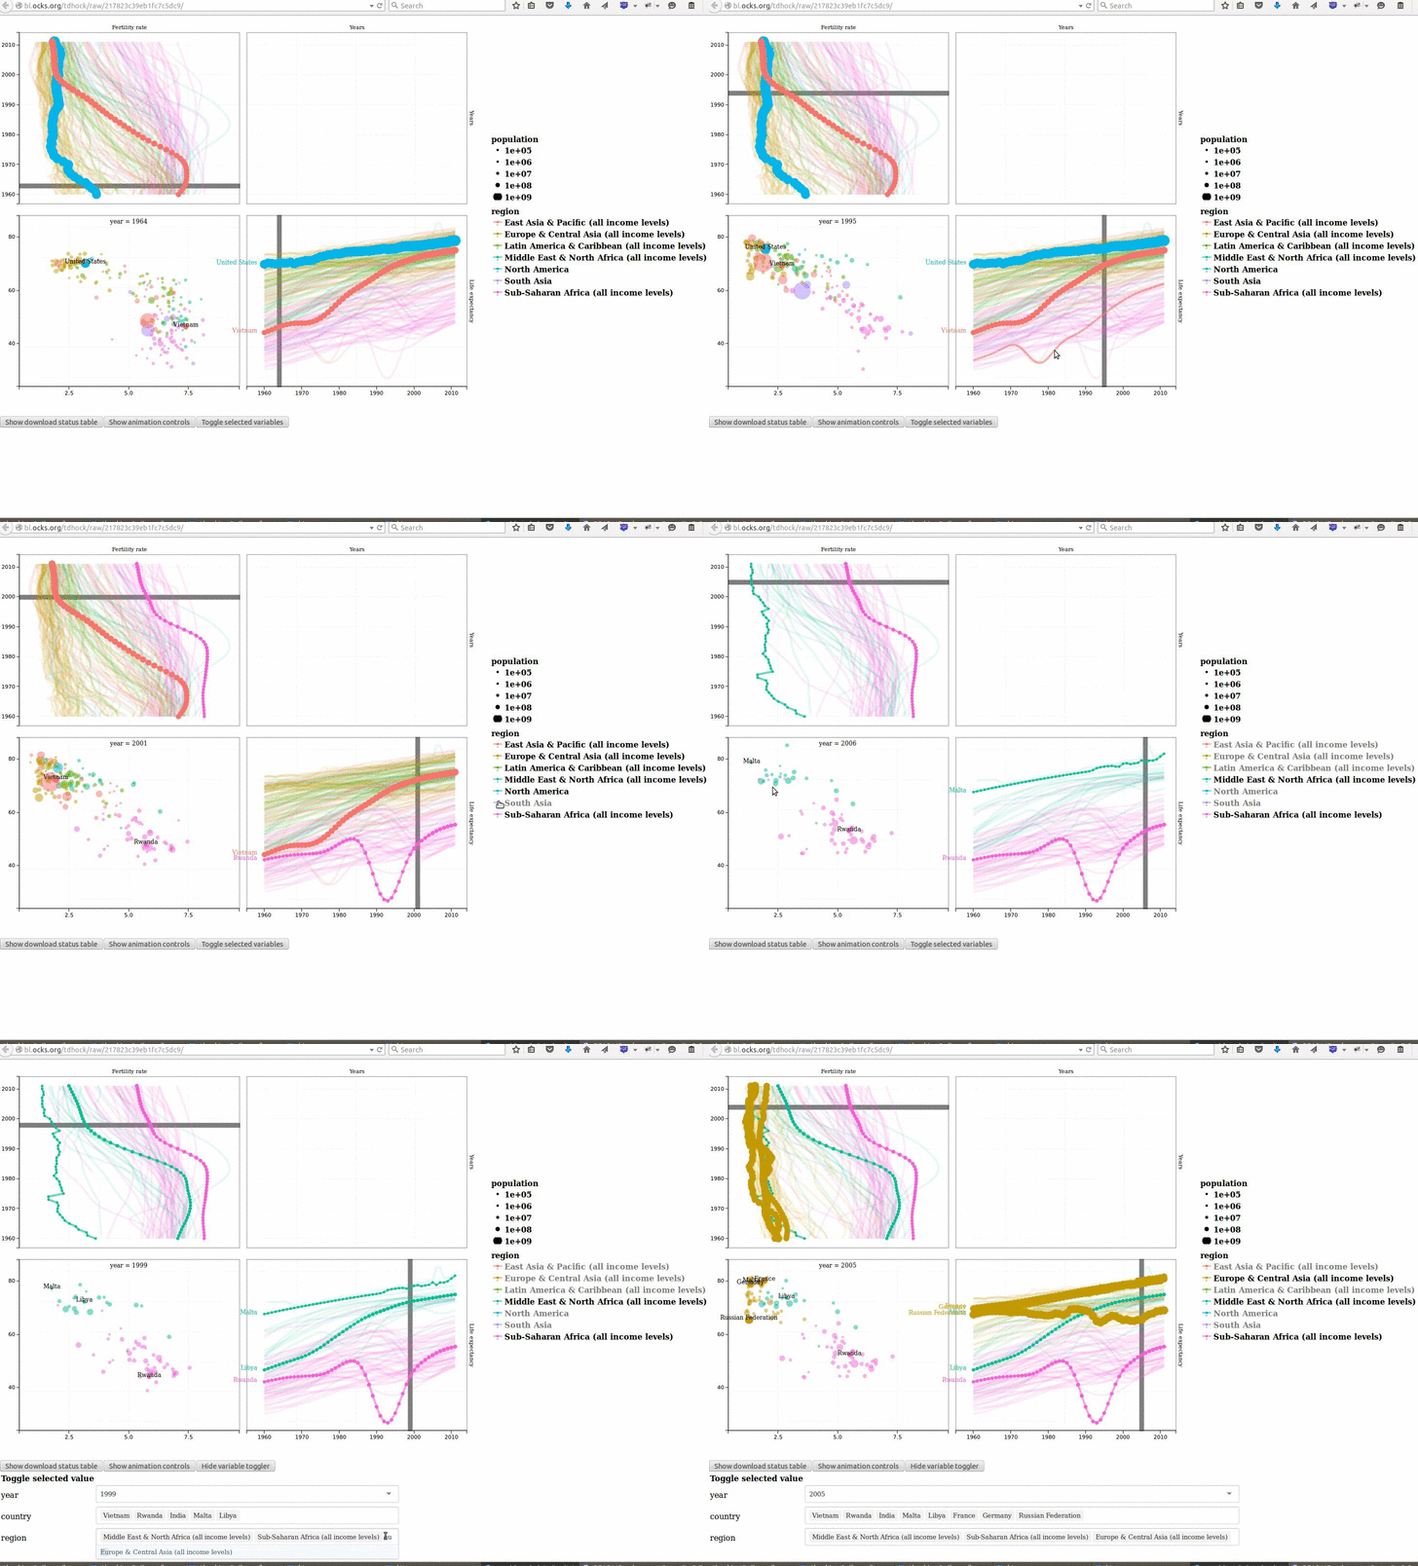
Rendered webpage:

Source: Project Animint2
 lazycipher
 Animint2 Testing Documentation